How Sysadmins monitor your Java application with JMX
some time ago Aljona showed
how to monitor and manage your java application with jmx
I’m going to show, how you can make use of JMX from the viewpoint of a sysadmin.
initial point:
You have a Java-application deployed in an applicationserver like JBoss or Tomcat and you want to monitor the health of this application(including the applicationserver and the Java-virtual-machine it is running in) with a tool like Nagios.
Use Jolokia on the server-side!

Why do i have to use an extra Agent for this? My applicationserver is able to use Mbeans.
Of course you don’t have to, but Jolokia is a HTTP/JSON bridge, which means jolokia can be accessed via HTTP and responds with JSON, that is cool, isn’t it?
There are some more advantages like bulk-requests and it supports cubism.js since version 1.0.5 (Jonathan uses this to get some nicely visualized charts) … and it’s fast.
Just deploy it into your applicationserver it isn’t that big.
As a sysadmin i don’t want to code Java nor do i want to have a JVM running on my Nagios-server, i’m used to use perl ( just to satisfy any prejudices), so i stumbled over jmx4perl and decided to make use of this.
I installed jmx4perl and read the documentation.
cpan[1]> install JMX::Jmx4Perl
The tools brought along by jmx4perl are really very useful:
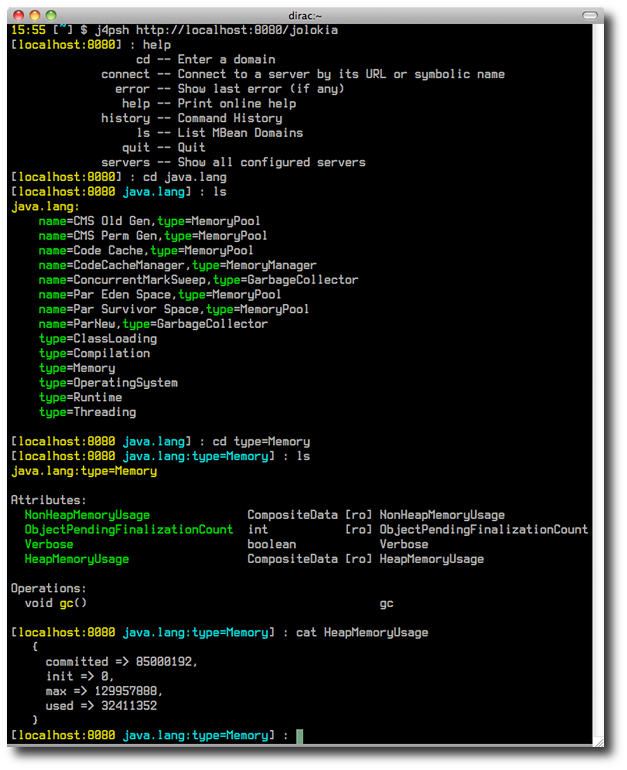
- The commandlinetool j4psh is awesome, you can browse the JMX Mbeans in color by using “cd” and “ls” with “cat” you can get the value of an attribute… tab-completion as a matter of course.
- With the commandlinetool jmx4perl you can easily test requests and get responses in various forms.
Time to hack:
First Nagios-test we assemble is for monitoring heapspace of the JVM, not only because it’s often referenced in the documentation but rather because thats often a useful information to identify memory leaks and to know when it’s time to restart the application(server). But you can follow most of the following steps for many other use cases too.
- be sure you got the relevant permissions in jolokia (jolokia-access.xml)
- search for older Nagios-Plugins and c’n’p the generic parts…
- search for the Mbean with j4psh or use type search of jolokia and look for interesting attributes/operations
- test the request you have in your mind with e.g jmx4perl
- canonicalize the request
my $request = new JMX::Jmx4Perl::Request({
                                          type => READ,
                                          mbean => "java.lang:type=Memory",
                                          attribute => "HeapMemoryUsage",
                                         });
#print(Dumper($request));
my $response = $jmx->request($request);
#print(Dumper($response));
- dereference the response as you need
my $used_memory=$response->value()->{'used'};
my $max_memory=$response->value()->{'max'};
- start a heated debate about sensible values for warning and critical
- deploy your Nagios-plugin
- copy the script into your plugin-folder of your Nagios-server
- install all missing libraries on the Nagios-server
- define the command in commands.cfg
define command{
  command_name check_jmx4perl_heapspace.pl
  command_line $USER1$/check_jmx4perl_heapspace.pl $HOSTADDRESS$ $ARG1$
}
- make use of the new command in your services.cfg (or whatever you’ve called your file)
define service{
  use                 remote-service
  host_name           jolokia-host
  service_description HeapSpace of JavaApp
  check_command       check_jmx4perl_heapspace.pl!8084
}
- lean back while watching the heapspace grow…